
Atlas Deep Dive

Atlas Deep Dive
1. Executive Summary & Context
The primary objective of this architecture is to establish a cloud-agnostic, high-performance Kubernetes environment. By decoupling the application layer from specific Cloud Service Provider proprietary APIs, the organization achieves significant cost optimization, architectural sovereignty and ease future-proof extensibility.
2. Design Pillars
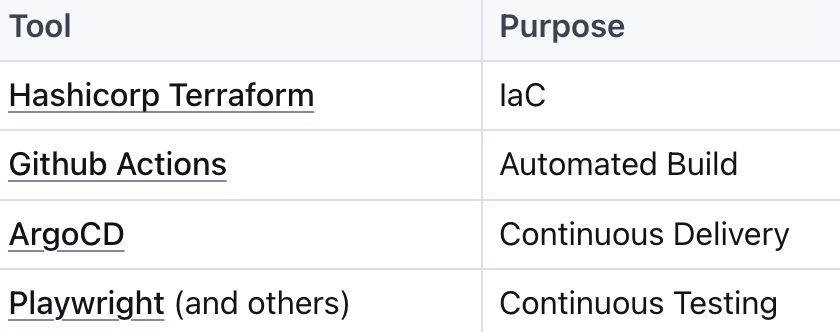
Automation
Deployment and life-cycle of the application and underlying infrastructure is automated via CI/CD/CT pipelines, leveraging the right tools for each layer of the infrastructure.
Portability
Automation along with the design behind the infrastructure allow us to easily migrate or deploy our application on several infrastructure configurations:
- On-cloud IaaS instances (Amazon EC2/Google GCE/Azure VMs)
- On-cloud CaaS instances (Amazon EKS/Google GKE/Azure AKS)
- On-prem IaaS infrastructure (VMware/RedHat)
- On-prem baremetal deployments (physical k8s nodes)
- On prem CaaS infrastructure (VMware TKG/Redhat Openshift)
Adaptability
The agnostic nature of our infrastructure and Kubernetes clusters allow us to easily integrate new application elements and infrastructure elements as plug-and-play building blocks.
- New applications as Kubernetes resources (e.g. new monitoring system, new metrics and reporting system…)
- New infrastructure elements (e.g. remote on-premise GPU-enabled node added to the cluster; different cloud provider node added to the cluster…)
Security by Design
Infrastructure security elements and practices are designed and implemented right from the get-go.
- Access to the infrastructure happens via a bastion host that implements least privilege policies and enables auditing and traceability of performed actions
- Role-Based-Access-Control is implemented at the Kubernetes level
- Cloud provider firewall and Kubernetes Network Policies are implemented to apply micro-segmentation and secure the network.
3. High-Level Architecture
System Diagram
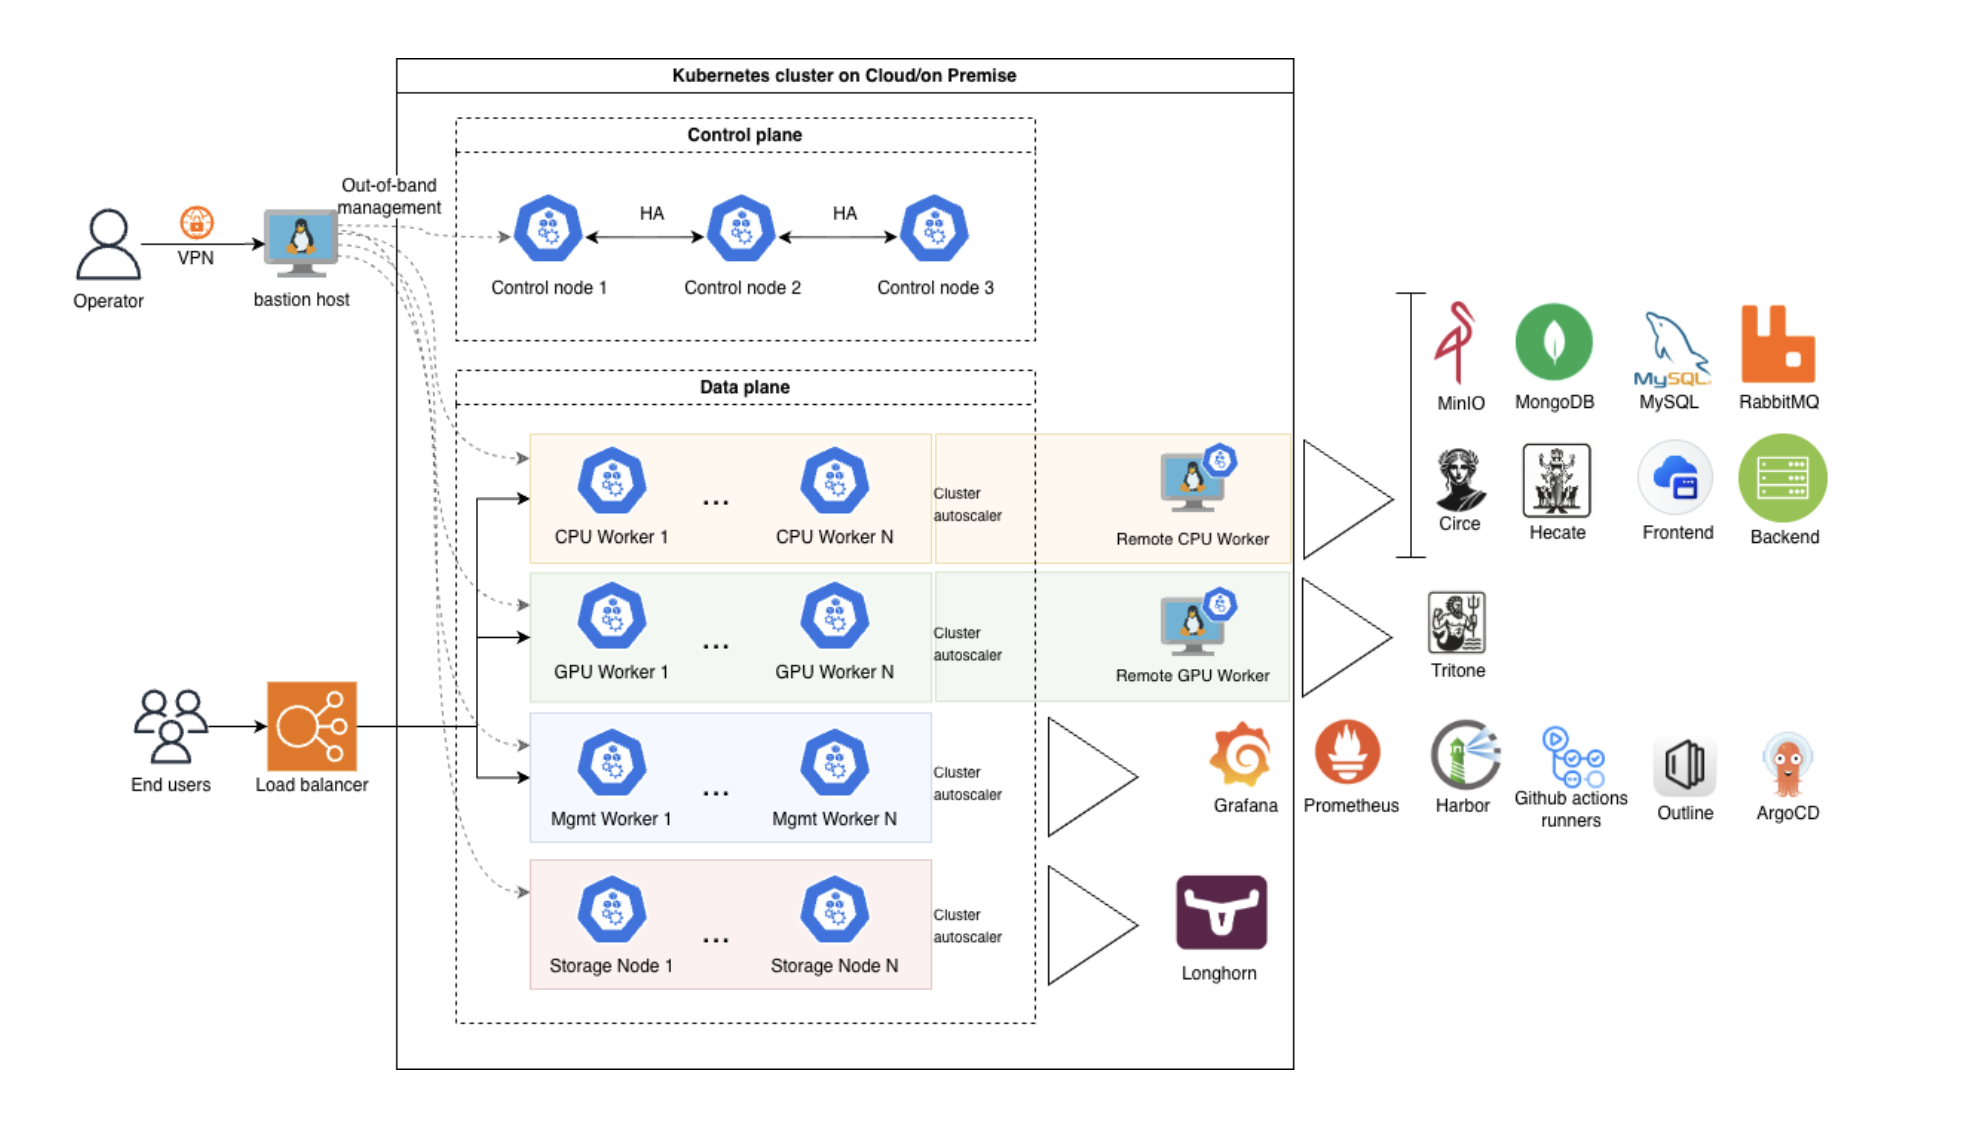
The Atlas infrastructure comprises the foundation upon which our application stack runs. It is an upstream Kubernetes deployment initiated without any specific cloud controller manager.
The control plane is made of three control nodes with a stacked etcd cluster; a load balancer sits in front of them (not depicted).
The nodes are divided in different logical clusters, each of which has a role label. Workloads are assigned to different nodes via nodeSelector on the role label.
Component Breakdown
Bastion host
The bastion host is a VM running OVH the bastion. This is the only host enabled to access infrastructure elements via ssh for out of band management. Using the bastion we are able to define groups with varied level of permissions, and assign each user to a group depending on their required access level. The bastion host is only reachable by VPN and the access is via key exchange. On this host, ssh sessions are recorded and backed up periodically, and audit logs are sent to an external log collector, Wazuh.
Wazuh
Wazuh is a SIEM and XDR system. We use it as a log collector both for audit, infrastructural and application log collector. This system is a stand alone deployment on the cloud, and is not hosted on the kubernetes cluster.
Control plane
This is a standard Kubernetes control plane deployment with stacked etcd. A load balancer sits in front of the nodes to balances requests to the kubeapi server. The load balancer ip is the target of the kubeadm join commands.
Data plane
The data plane is comprised of different logical clusters. The subdivision is necessary for the following reasons:
- We self host storage capabilities via Longhorn. For this, we dedicate nodes to provide the disks, CPU, RAM and network resources for the storage stack
- We need nodes equipped with GPUs that will exclusively host inference workloads
- Workloads that are core to our application will be hosted on cpu optimized VMs/hardware
- Management workloads like internal registry, internal KX portal, self hosted github runners and monitoring tools like prometheus and grafana are hosted on dedicated nodes. It is especially important to segregate monitoring tools from the rest of the workloads since in the case of incident, you want these tools to be up and running and reachable
4. Technical Deep Dive
Infrastructure & Provisioning
Basic infrastructure building blocks are spun up using Hashicorp Terraform. Terraform uses providers to interact with cloud providers, SaaS providers and other APIs.
There are providers for every major public and private cloud providers. The idea is to have one or more terraform root module for each possible provider (for example: aws, gcp, azure, vmware, openstack).
As per the IaC paradigm, the .tfvars files in the infrastructure repository describe the desired state of the environment and they represent the source of truth for infrastructure configurations. When a new environment needs to be set up, a new folder is created under identifai/<provider>/environments and the list of modules is copied over from another environment. Then the terraform.tfvars for the new environment is compiled. The main.tf inside an environment calls the related module inside identifai/<provider>/modules (i.e. the actual code of the module is only present inside the modules folder and not repeated for each environment).
identifai/
├── aws/
│   ├── environments/
│   │   ├── prod1/
│   │   │   ├── base/
│   │   │   │   ├── main.tf
│   │   │   │   ├── outputs.tf
│   │   │   │   ├── terraform.tfvars
│   │   │   │   └── variables.tf
│   │   │   ├── workers/
│   │   │   │   └── [...]
│   │   │   └── alb/
│   │   │       └── [...]
│   │   ├── prod2
│   │   └── staging
│   └── modules/
│       ├── base/
│       ├── workers/
│       └── alb/
├── gcp/
│   ├── environments/
│   │   ├── prod3/
│   │   └── prod4/
│   └── modules/
│       ├── base/
│       ├── workers/
│       └── lb/
└── vmware/
    └── ...
Currently the aws modules have been developed. The deployment of a new environment on aws runs as follows:
- Terraform apply on module
base- deletes the default vpc
- creates a new vpc with specific private subnets (we want to avoid subnet overlapping between our cloud environments)
- creates security groups
- creates EC2 key pair
- creates control plane instances
- creates NLB and target groups for kubeapi
- Manual creation of the kubernetes cluster control plane, and installation of calico CNI
- Terraform apply on module
workers- creates worker nodes and injects user-data to automatically join the cluster
- Manual installation of ingress-nginx, longhorn, argocd
- Terraform apply on module
alb- creates ALB certificate on ACM
- creates DNS records on route53 for certificate validation
- creates ALB and target groups for kubernetes workloads
- creates DNS records on route53 for the new application endpoints
After this workflow the kubernetes workloads are installed via ArgoCD.
Integration & Delivery
Every application in the internal stack has its own building pipe in its Github repository. We use Github Actions to run a battery of tests before pushing the image to our internal registry, if all tests are successful.
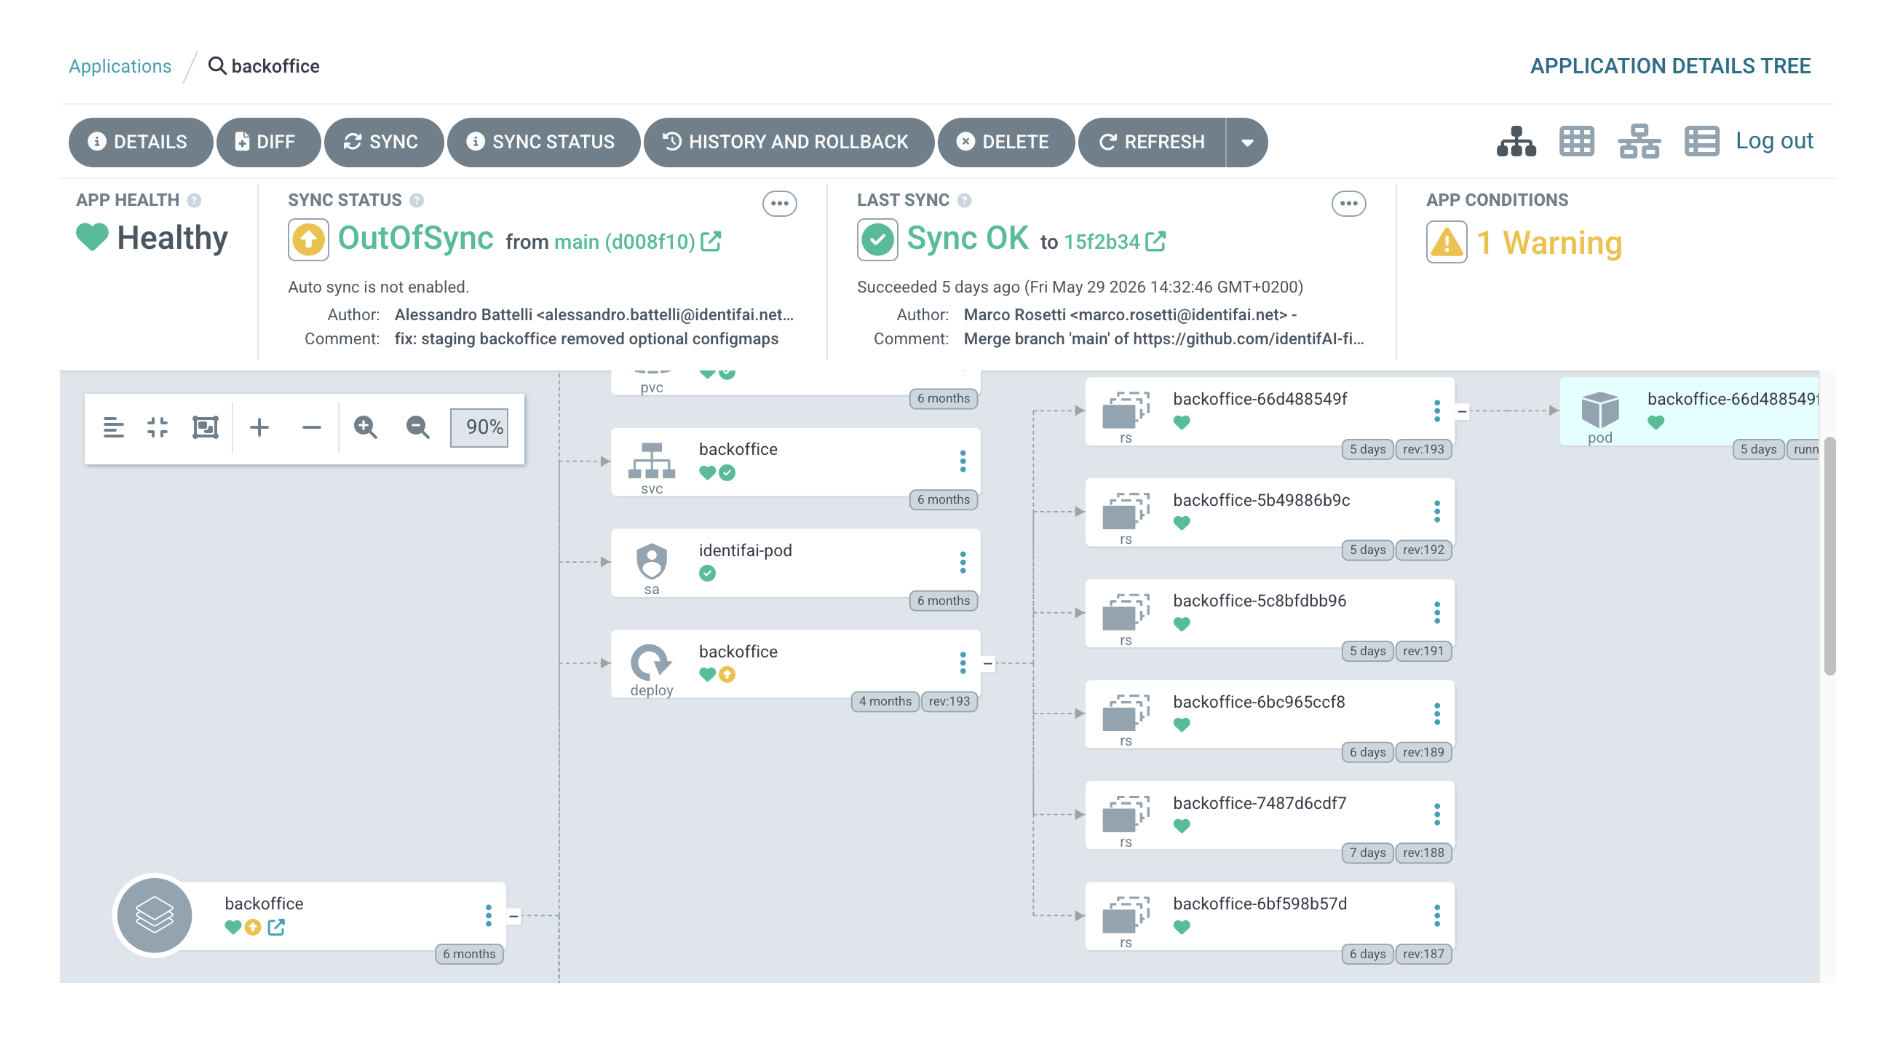
We have a dedicated project for IaC. In this project, for each application we define an Application item on ArgoCD. The folder is structured to have application files along with the values for each environment under an apps folder, and then Application items for ArgoCD under the environments folder. Then, each ArgoCD instance will read the Applications from its specific environment.
identifai-gitops/
├── apps/
│   ├── backoffice/
│   │   ├── templates/
│   │   │   ├── xx.yaml
│   │   │   └── yy.yaml
│   │   ├── values/
│   │   │   ├── staging.yaml
│   │   │   └── prod.yaml
│   │   ├── Chart.yaml
│   │   └── values.yaml
│   └── application xyz/
│       ├── templates
│       ├── values
│       ├── Chart.yaml
│       └── values.yaml
└── environments/
    ├── prod/
    │   ├── prod-x/
    │   │   ├── backoffice-app.yaml
    │   │   └── application-xyz-app.yaml
    │   ├── prod-y
    │   └── prox-z
    └── staging/
        ├── backoffice-app.yaml
        └── application-xyz-app.yaml
For each application, the values.yaml file will contain default values and parameters that are common to every environment, whereas the values folder will contain environment-specific variables.
Example of values.yaml file:
# Default values for backoffice.
# This is a YAML-formatted file.
# Declare variables to be passed into your templates.

replicaCount: 1

image:
  repository: registry.com/identifai/identifai/backend
  pullPolicy: IfNotPresent
  # Overrides the image tag whose default is the chart appVersion.
  tag: ""

serviceAccount:
  create: true
  automount: true
  annotations: {}
  name: "identifai"

podAnnotations: {}
podLabels: {}

# Vault Agent Injector configuration
vault:
  enabled: false
  role: ""
  secrets: {}
  # Static secret render interval
  staticSecretRenderInterval: "30s"

securityContext: {}

# Container configuration
containerPort: 80
workingDir: /var/www

# Service configuration
service:
  name: ""
  type: ClusterIP
  port: 80
  targetPort: 80

# Ingress configuration
ingress:
  enabled: false
  className: nginx
  annotations: {}
Example of environment specific yaml file:
image:
  tag: "v1.11"

replicaCount: 1

resources:
  requests:
    cpu: 1
    memory: 512Mi
  limits:
    memory: 1.5Gi

securityContext:
  capabilities:
    add:
      - SYS_PTRACE

vault:
  enabled: true
  role: "staging"
  secrets:
    [...]

env:
  - name: SAMPLE_ENV_VAR
    value: var_value

ingress:
  enabled: true
  annotations:
    nginx.ingress.kubernetes.io/enable-cors: "true"
    nginx.ingress.kubernetes.io/cors-allow-origin: "[origins]"
    nginx.ingress.kubernetes.io/cors-allow-methods: "PUT, GET, POST, OPTIONS, DELETE, PATCH"
    nginx.ingress.kubernetes.io/cors-allow-credentials: "true"
    nginx.ingress.kubernetes.io/cors-allow-headers: "Content-Type,Authorization,X-Requested-With"
  [...]

nodeSelector:
  role: worker-mgmt

affinity:
  podAntiAffinity:
    preferredDuringSchedulingIgnoredDuringExecution:
      - weight: 100
        podAffinityTerm:
          labelSelector:
            matchLabels:
              app.kubernetes.io/name: backoffice
          topologyKey: kubernetes.io/hostname
Example of ArgoCD Application file:
apiVersion: argoproj.io/v1alpha1
kind: Application
metadata:
  name: backoffice
  namespace: argocd
spec:
  project: default
  source:
    repoURL: git@github.com:<repo-url>.git
    targetRevision: main
    path: apps/backoffice
    helm:
      valueFiles:
        - values.yaml
        - values/staging.yaml
  destination:
    namespace: identifai
    server: https://kubernetes.default.svc
  syncPolicy:
    automated:
      enabled: false
    syncOptions:
      - CreateNamespace=true
      - RespectIgnoreDifferences=true
After a new version of the image is released, or when configurations values are updated, the change is committed and pushed in the identifai gitops project. On ArgoCD, we then update and sync the Application to push the update on the actual environment.
In the future we will consider adopting a continuous approach and automatically build the image and sync on ArgoCD as new code is pushed to the main branch of our projects.
Autoscaling
For node autoscaling, we use cluster-autoscaler and horizontal pod autoscaler.
HPA is responsible for scaling deployments based on the value of a specific metrics (i.e. add new pods when the current ones are struggling with the workload).
Cluster autoscaling is responsible for adding new nodes to the kubernetes cluster once it detects that current nodes are not providing enough resources to host the scheduled pods.
Different components of the system will scale based on different metrics, such as:
- php-fpm queued messages for Laravel pods
- rabbitmq ready messages for cpu-heavy queue consumers
- triton inferences queue times for GPU pods
For the purpose of this article we will examine the use-case of autoscaling inference pods and nodes.
Nvidia has a nice blog post about autoscaling triton inference server in a kubernetes environment.
The internal container we use for inference is based on Nvidia triton inference server. Triton exports metrics we can use with HPA.
Our environment monitoring stack is based on kube-prometheus-stack so we already have a prometheus instance running. What we need is:
- A prometheus PodMonitor to scrape the triton metrics off the pods
- A prometheus adapter to create the custom metric that will be used by the HPA
- The horizontal pod autoscaler which will query the custom metric and schedule new pods when the metric is above threshold
- The cluster-autoscaler which will create new GPU nodes when the HPA pod is not able to be scheduled
PodMonitor
The PodMonitor kind is a CRD installed with kube-prometheus-stack. To know which pods it should monitor, it needs a selector for namespace and for labels. Moreover, a podMetricsEndpoint configuration is needed to specify at which port and path the pod exports the metrics.
This is the resulting tritonmetrics.yaml.
apiVersion: monitoring.coreos.com/v1
kind: PodMonitor
metadata:
  name: kube-prometheus-stack-tritonmetrics
  namespace: monitoring
spec:
  namespaceSelector:
    matchNames:
      - identifai
  podMetricsEndpoints:
    - interval: 3s
      path: /metrics
      port: metrics-triton
  selector:
    matchLabels:
      app.kubernetes.io/name: tritone
Install with kubectl apply -f tritonmetrics.yaml (or as part of an ArgoCD application).
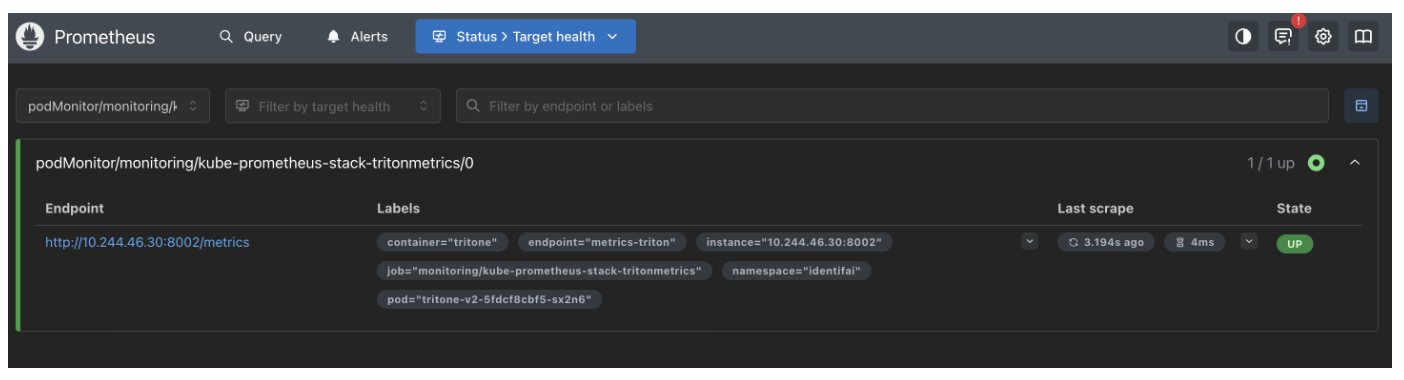
If everything is done correctly, from the prometheus UI you will see the PodMonitor as a new healthy target:
Prometheus Adapter
The prometheus adapter is used to create custom metrics that can be used by horizontal pod autoscaler to scale pods. The adapter filters all pods exposing a nv_inference_queue_duration_us metric and on those pods it calculates the triton_avg_queue_us metric. This metric computes the average queue time per inference request in the past 30 seconds. We deploy it via helm chart and the custom values used are the following:
rbac:
  create: true
prometheus:
  url: http://prometheus-kube-prometheus-prometheus.monitoring.svc.cluster.local
  port: 9090
rules:
  default: false
  custom:
    - seriesQuery: 'nv_inference_queue_duration_us{namespace!="",pod!=""}'
      resources:
        overrides:
          namespace: { resource: "namespace" }
          pod: { resource: "pod" }
      name:
        as: "triton_avg_queue_us"
      metricsQuery: |
        (
          sum by (namespace, pod) (
            delta(nv_inference_queue_duration_us{<<.LabelMatchers>>}[30s])
          )
        )
        /
        (
          sum by (namespace, pod) (
            1 + delta(nv_inference_request_success{<<.LabelMatchers>>}[30s])
          )
        )
Once deployed, you can check this metric is working via kubectl:
$ kubectl get --raw "/apis/custom.metrics.k8s.io/v1beta1/namespaces/identifai/pods/*/triton_avg_queue_us" | jq .
{
  "kind": "MetricValueList",
  "apiVersion": "custom.metrics.k8s.io/v1beta1",
  "metadata": {},
  "items": [
    {
      "describedObject": {
        "kind": "Pod",
        "namespace": "identifai",
        "name": "tritone-v2-5fdcf8cbf5-sx2n6",
        "apiVersion": "/v1"
      },
      "metricName": "triton_avg_queue_us",
      "timestamp": "2026-04-29T16:10:41Z",
      "value": "0",
      "selector": null
    }
  ]
}
Horizontal pod autoscaler
For the hpa configuration we need to give it the metric to monitor, a threshold value, and the behavior of the hpa. The metric is triton_avg_queue_us and the threshold we want to use is 100ms (which is 100.000 microseconds).
For the behavior, we want to define stabilization windows to avoid flapping of the pods: since a triton inference server pod needs 1 GPU, and we use nodes with 1 GPU, each pod will fully reserve one node. HPA scale up thus corresponds to cluster autoscaler scale up, which takes a while: the new node is spun up, it joins the cluster, calico and longhorn daemonsets are installed, the nvidia gpu operator configures the drivers on the node, then the triton pod is scheduled. The triton pod startup process also takes some time as it reads inference models weights from remote storage. We estimated this process to take about 10 minutes and thus we have a scale up stabilization window of 10 minutes and also a maximum number of scale ups of 1 every 10 minutes (in the policies key).
apiVersion: autoscaling/v2
kind: HorizontalPodAutoscaler
metadata:
  name: tritone-hpa
spec:
  scaleTargetRef:
    apiVersion: apps/v1
    kind: Deployment
    name: tritone
  minReplicas: 1
  maxReplicas: 4
  metrics:
    - type: Pods
      pods:
        metric:
          name: triton_avg_queue_us
        target:
          type: AverageValue
          averageValue: "100000"
  behavior:
    scaleDown:
      stabilizationWindowSeconds: 100
    scaleUp:
      stabilizationWindowSeconds: 600
      selectPolicy: Max
      policies:
        - periodSeconds: 600
          type: Pods
          value: 1
Cluster autoscaler
Cluster autoscaler examines the status of the kubernetes cluster: if it finds pods that are unschedulable due to lack of resources, and if it knows there are autoscaling capabilities to satisfy those resources, then it triggers a node scale. Cluster autoscaler can integrate with a long list of cloud providers; in aws, cluster autoscaler works with Autoscaling Groups and uses tags to assess the capabilities of the nodes. When cluster autoscaler asks “will expanding this autoscaling group satisfy the kubernetes pods resource requests?”, to answer this question cluster autoscaler will look at tags. Tags advertise the cluster name, the node labels (used with nodeSelector), the node taints and the node resource capabilities (will the node have a GPU?). With these informations it can perform informed decisions regarding which autoscaling group to scale up.
An example of used tags is seen below:
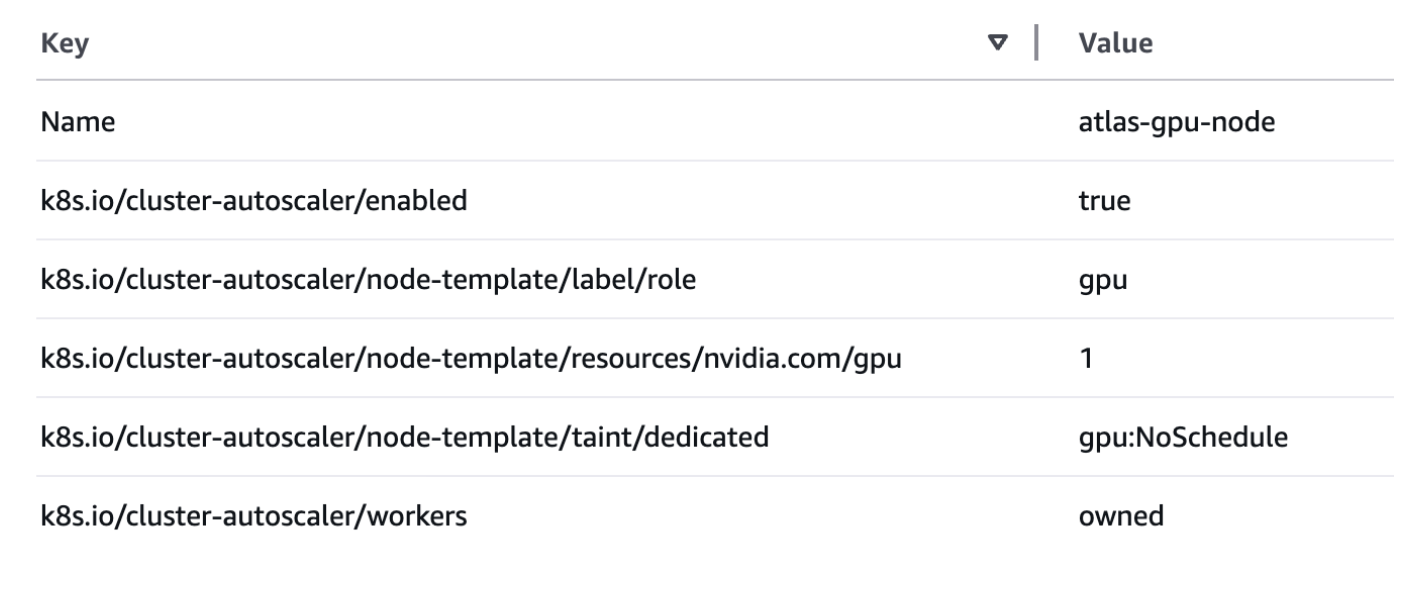
The cluster autoscaler is deployed via helm chart using argo, and an example of valid custom values is below. As with HPA, there are timers to avoid flapping nodes.
autoDiscovery:
  clusterName: workers
  enabled: true

rbac:
  create: true
  serviceAccount:
    create: true
    name: cluster-autoscaler

awsRegion: eu-north-1

nodeSelector:
  role: worker-mgmt

extraArgs:
  expander: least-waste
  aws-use-static-instance-list: "false"
  v: 4
  scale-down-delay-after-add: 10m
  scale-down-delay-after-failure: 1m
  scale-down-unneeded-time: 10m
  max-node-provision-time: 15m
Networking & Security
As a CNI we selected Calico as it provides advanced security policies configuration, a VxLAN overlay and relative ease of use. We have a GlobalNetworkPolicy with a default deny and different tiers of network policies.
- Platform Tier: Allow mandatory kubernetes infrastructure traffic (DNS, Metrics, Logging).
- Application Infrastructure Tier: Allow supporting services (Longhorn, MongoDB, Mysql, RabbitMQ, Redis)
- Application Tier: Allow core application service-to-service rules (frontend, backoffice, circe, hecate, tritone)
For ingress we have ingress-nginx but are planning to migrate to new, better supported alternatives.
For secrets management we use hashicorp vault, hosted locally on the kubernetes cluster.
At the node level, we have set up routing between all the private networks of our environments using nebula.
Observability
For the observability stack we use kube-prometheus-stack, the grafana instance therein, Loki, Tempo and grafana cloud services for health checks.
Grafana
We have multiple environments spanning across the globe. For every environment, prometheus is gathering all the metrics locally, while grafana is not enabled. Only one environment is elected to host the grafana instance to provide visibility for all environments.
In this instance, a prometheus datasource is added for every environment. This prometheus is exposed via an aws internal network load balancer.
In grafana we have the following dashboards:
- AWS EC2 health
- AWS Billing and Costs: executive view and detailed view
- AWS WAF
- Application versions across all our environments
- Kubernetes default views: Compute resources, Networking etc
- Longhorn
- RabbitMQ
- Triton Inference Server
- K8s Nodes
In grafana different alerts are configured, sending notifications to a dedicated slack channel when issues arise such as:
- Pod no more running
- Longhorn volumes capacity
- Node level storage capacity
- others…
Logging
We leverage node level wazuh agent to send logs to Wazuh.
Wazuh agent collects logs from the filesystem. To tell the agent to grab kubernetes pod logs, we define specific rules:
local_rules.xml
[...]
<group name="kubernetes,">
  <rule id="100500" level="3">
    <location type="osmatch">/var/log/containers/</location>
    <description>Kubernetes container log</description>
    <group>kubernetes,container,</group>
  </rule>

  <rule id="100501" level="3">
    <if_sid>100500</if_sid>
    <field name="location">/([^/-]+)-[a-z0-9]+-[a-z0-9]+_</field>
    <description>Kubernetes log from app: $(location)</description>
    <group>kubernetes,container,</group>
  </rule>
</group>
[...]
These rules are then applied to specific agents or agent groups from the wazuh dashboard. From that moment onward, the agent will send to the collector all logs contained inside /var/log/containers/.
Once the wazuh server receives these logs, we need to decode them to create fields in the logs to help us search them up and read them when needed.
local_decoder.xml
[...]
<decoder name="k8s-cri-log">
  <prematch>^\d{4}-\d{2}-\d{2}T</prematch>
</decoder>

<decoder name="k8s-cri-log-fields">
  <parent>k8s-cri-log</parent>
  <regex>^(\S+)\s+(\S+)\s+(\S+)\s+(.*)$</regex>
  <order>k8s_cri_timestamp, k8s_cri_stream, k8s_cri_flag, k8s_message</order>
</decoder>
[...]
Decision Log & Trade-offs
Tools adoption and architectural decisions are evaluated keeping in mind our four design pillars.
5.1. Upstream Kubernetes vs. Managed Services (EKS/GKE/AKS)
- The Decision: We opted for a manual, upstream Kubernetes deployment using
kubeadmrather than using managed control planes like EKS or GKE. - The "Why": To achieve true cloud independency and portability. Managed services often inject proprietary sidecars, specific CNI requirements, or hidden IAM integrations that make "lifting and shifting" to on-prem bare metal nearly impossible without a total rewrite of the manifests.
- The Trade-off: We inherited the "Operational Tax" of managing the control plane. We are responsible for etcd health, certificates, and control-plane upgrades. We traded ease of use for total environment parity across clouds.
5.2. Calico CNI vs. Cloud-Native CNIs (e.g., AWS VPC CNI)
- The Decision: Selected Calico for networking and security policies.
- The "Why": Cloud-specific CNIs (like AWS VPC CNI) assign a real VPC IP to every pod. While performant, this leads to IP address exhaustion in large clusters and creates a hard dependency on the cloud's networking layer. Calico allows us to use an overlay (VxLAN), giving us a consistent, high-performance networking model that looks identical on AWS as it does on a VMware cluster.
- The Trade-off: Debugging VxLAN encapsulation is more complex than debugging native VPC routing. We accepted this complexity to ensure our NetworkPolicies (GlobalNetworkPolicy) work identically in every environment.
5.3. Longhorn (Self-Hosted SDS) vs. Managed Block Storage
- The Decision: We chose to self-host our storage layer using Longhorn instead of relying purely on AWS EBS or Google Persistent Disks.
- The "Why": Storage is often the biggest "anchor" that prevents cluster portability. By using Longhorn, the storage lives within the cluster logic. If we migrate a workload from AWS to an on-prem bare-metal node, the storage replication logic remains the same.
- The Trade-off: Longhorn consumes "Data Plane" resources (CPU/RAM/Disk) that could otherwise go to applications. There is also a slight IOPS latency compared to raw, native cloud block storage. We mitigated this by dedicating specific "Storage Nodes" in our architecture.
5.5. Nebula Mesh vs. Traditional VPN/VPC Peering
- The Decision: Utilizing Nebula for node-level routing between different private environments.
- The "Why": VPC Peering and Transit Gateways become expensive and complex as you scale across multiple regions and clouds. Nebula provides a "zero-trust" overlay mesh that allows nodes in AWS to talk to nodes in a private data center as if they were on the same local switch, regardless of the underlying IP space.
- The Trade-off: Using Nebula to route traffic introduces overhead as the traffic is encrypted and decrypted when it enters and exits the vpn tunnels. Moreover, Nebula requires a "Lighthouse" (discovery server) to be maintained. We chose this to avoid the "fragmented network" problem inherent in multi-cloud builds.
5.6. Wazuh (Self-Hosted) vs. Cloud SIEM (CloudWatch/Sentinel)
- The Decision: Deploying Wazuh as a standalone SIEM rather than using cloud-native logging.
- The "Why": We required a unified security view. Using CloudWatch for AWS and Stackdriver for GCP would mean our security team has to learn three different query languages. Wazuh gives us a single source of truth for file integrity monitoring (FIM) and log analysis across the entire Atlas fleet.
- The Trade-off: Managing a SIEM is resource-intensive. We have to manage the storage and indexing of millions of logs, which adds to the project’s infrastructure overhead.
6. Challenges & Lessons Learned
We want to mention two main challenges when setting up our own infrastructure from scratch.
6.1 Precise resource usage benchmarks per application
To manage cloud costs, we aim to deploy the minimum number of Kubernetes nodes at all times. For the DevOps and Infrastructure team, this shatters the illusion of 'infinite' resources typically associated with the public cloud. Instead, we must carefully tweak the CPU and RAM resources allocated to our pods, searching for that perfect balance between minimizing costs and avoiding CPU starvation or dreaded OOM kills.
Typically, the Software Development team is out of this loop. Burdened instead with software architectural patterns and business logic, they don’t factor in efficiency and resource usage. The concrete risk here is unbound resource consumption.
- “What if we get 1000 times the requests you expect?”
- “What if the payload is 100x the size we tested with?”
In the worst-case scenario, pods will eat up more ram until the nodes begin killing processes, or worse, the underlying EC2 instances become entirely unresponsive. For CPU-intensive pods, they can starve adjacent workloads of resources until Kubernetes health checks fail, causing probes to time out and restart the affected pods.
This is why the software development team should be kept in the loop at all times:
- They should be mindful of the memory profile of the application they are developing. Are there specific functions that consume lots of RAM or CPU?
- If they get a lot of input for what their application is consuming, how will the application behave? Are there queueing strategies? And if so, what are the timeouts?
- What is the maximum theoretical RAM and CPU usage for the application?
Resource usage benchmarks should be made part of the standard testing playbooks and should at least be done periodically. Keep in mind that in a Kubernetes micro-services infrastructure, it is better to have less resource-consuming pods, but that can be easily scaled horizontally if needed.
6.2 Application monitoring and observability
Similarly to the previous point, the infrastructure and development teams should collaborate closely on application-level monitoring and observability. Since Kubernetes logs are gathered from containers standard output, and logging tools parse them based on specific syntax, a shared agreement must be established early in the software development lifecycle. Moreover, applications should expose a metrics API to be leveraged by the Horizontal Pod Autoscaler.
- Standardized Output: All logs must be printed or redirected to standard output (
stdout). - Consistent Formatting: Log formats and syntax must adhere to a shared, agreed-upon standard.
- Exposed Metrics: Applications should expose relevant observability and autoscaling metrics in a format ingestible by the monitoring system (e.g., Prometheus format at
/metrics) to be utilized by the Horizontal Pod Autoscaler.
5. Conclusion
Infrastructure is an evolving ecosystem, not a static monument. As Atlas matures beyond its initial implementation phase, the roadmap focuses on driving further operational efficiencies:
- Continuous GitOps Automation: Transitioning ArgoCD from manual synchronizations to an fully automated, continuous deployment model directly tied to Git branches. Adopting Continuous Testing with gates.
- Ingress Modernization: Migrating away from
ingress-nginxtoward more modern API gateways that align with contemporary service mesh paradigms. - Cross-Provider Expansion: Actively developing and rolling out the GCP, Azure and baremetal module paths within the unified GitOps repository structure to realize full multi-cloud IaC deployment.
Ultimately, Atlas achieves its core mission: it provides our engineers with a predictable, scalable, and highly adaptable playground while giving the organization the fiscal and strategic freedom to host workloads wherever it makes the most sense.
talk to a human expert
Tell us about your business. We'll come back to you within one business day.
No sales pitch. Just a conversation.
We stand for truth





Gartner does not endorse any vendor, product or service depicted in its researchpublications, and does not advise technology users to select only those vendors with thehighest ratings or other designation. Gartner research publications consist of the opinions ofGartner’s research organization and should not be construed as statements of fact. Gartnerdisclaims all warranties, expressed or implied, with respect to this research, including anywarranties of merchantability or fitness for a particular purpose. GARTNER is a registeredtrademark and service mark of Gartner, Inc. and/or its affiliates in the U.S. and internationallyand is used herein with permission. All rights reserved.